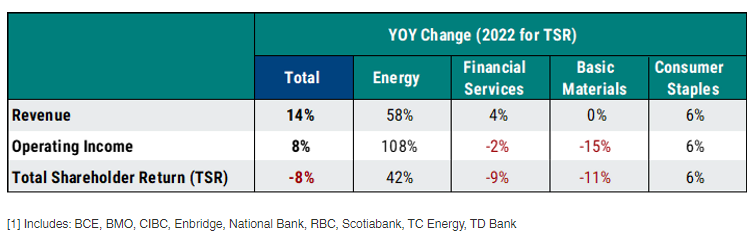
The following summarizes market trends among a sample of “early filers” including nine S&P/TSX 60 companies [1] to highlight expected trends through this proxy season, recognizing that a small sample may not be fully indicative of broader market trends which can vary by industry. As illustrated in Table 1 for the S&P/TSX 60, 2022 was a challenging year for many companies in Canada while the Energy sector had a strong recovery given positive commodity markets.
Table 1: 2022 S&P/TSX Performance Summary
Market Compensation Trends
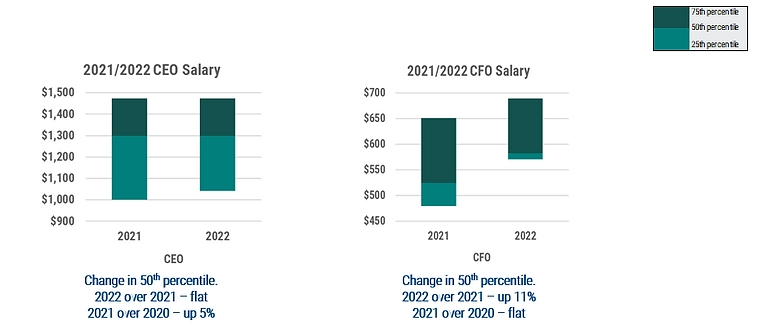
The following compensation trends are based on the same incumbent in both 2021 and 2022 and represent actual compensation disclosed for 2021 and 2022, including salaries, actual bonuses, and grant values of long-term incentives (all reported in CAD). As illustrated in Chart 1, salaries were relatively flat between 2021 and 2022 for CEOs and up over 10% at the 50th percentile for CFOs.
Chart 1: 2021 and 2022 Salaries
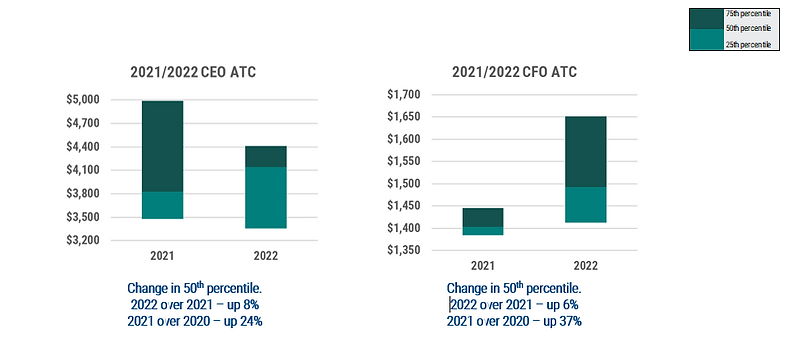
Actual bonuses for 2022 performance were relatively flat after a 45% increase in CEO bonuses last year. The 50th percentile corporate performance factor remained relatively flat in 2022 after increasing 40% from 2020 (from 0.87x target in 2020 to 1.2x target in both 2021 and 2022). This results in a more modest year-over-year increase in the 50th percentile actual total cash (ATC = salary plus actual bonus) for CEOs of 8% and for CFOs of 6% as illustrated in Chart 2 versus 24% and 37% increases last year, respectively.
Chart 2: 2021 and 2022 Actual Total Cash
Actual total direct compensation (ATDC = ATC + long-term incentives) was flat in 2022 given more moderate changes in year-over-year long-term incentive awards as illustrated in Chart 3. There was greater variability in CEO pay in 2022 v. 2021 as illustrated by the range between the 25th and 75th percentiles.
Chart 3: 2021 and 2022 Actual Total Direct Compensation
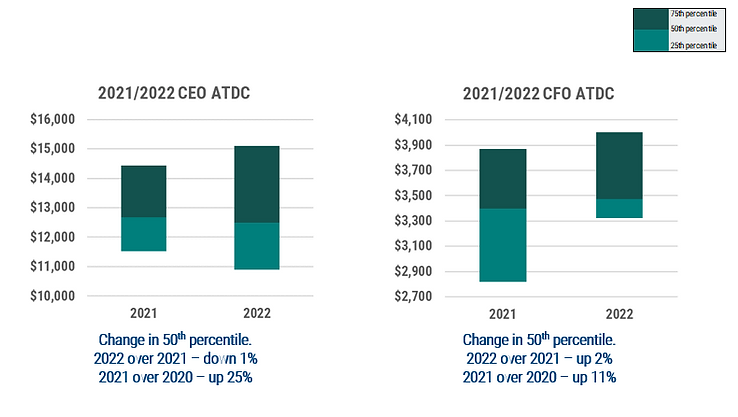
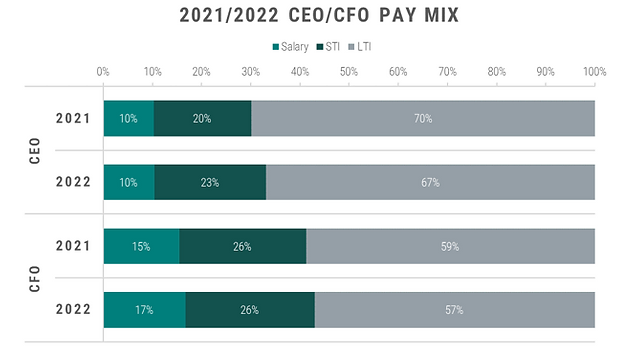
Chart 4 summarizes the overall pay mix for CEOs and CFOs which continue to put a majority weighting on long-term incentives (LTI), with short-term incentives (STI) at approximately 2.0x salary for CEOs and 1.5x for CFOs.
Chart 4: CEO and CFO Pay Mix
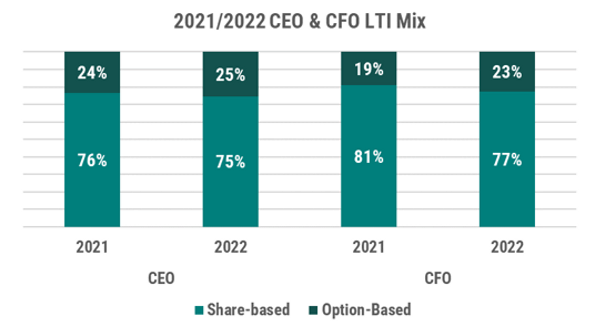
The average mix of long-term incentives granted to CEOs and CFOs in 2020 and 2021 did not materially change, with no structural adjustments made to the use of performance share units (majority weighted), restricted share units (limited usage) and stock options (minority weighted), as summarized in Chart 5. Stock options continue to be granted by eight of the nine companies in this sample despite the changes tax made in 2021.
Chart 5: CEO and CFO LTI Mix
2023 Expectations
We believe that these preliminary results will translate across the broader market, resulting in more moderate pay changes in 2022 relative to 2021 given the challenging performance conditions experienced through 2022 and expected through 2023. In our 2023 Human Resources Committee Outlook, we summarized our top five predictions for 2023 including an evolution of how ESG gets incorporated into compensation, potential challenges in overseeing incentives given market uncertainty and a greater focus on the long-term.
In reviewing the disclosure for these early filers, we observe the following examples of changes to executive compensation:
- RBC will include climate-based objectives within its medium and long-term incentives.
- Scotiabank will combine key ESG metrics with customer experience in determining the overall corporate performance factor with a weighting of 20%. In addition, they are increasing the weighting on corporate v. individual performance within the short-term incentive plan.
- Enbridge’s performance share units will include a 10% weighted greenhouse gas (GHG) metric.
About This Author
Ryan Resch, Senior Partner
Ryan is a founder and Senior Partner of Southlea, a GECN Group company. He has over 20 years of experience consulting complex organizations across North America on executive and broad-based compensation including related governance considerations. He is often the named executive compensation consultant representing either the human resources committee and/or management. Prior to forming Southlea, he worked in Willis Towers Watson’s Toronto and Vancouver offices leading many of the practice’s large client relationships.
He leverages this expertise to bring stakeholders together and drive meaningful change aligned with key business and talent priorities. He is known for providing fresh and innovative thinking with his most recent research focused on connecting environmental, social and governance (ESG) with people and pay programs.