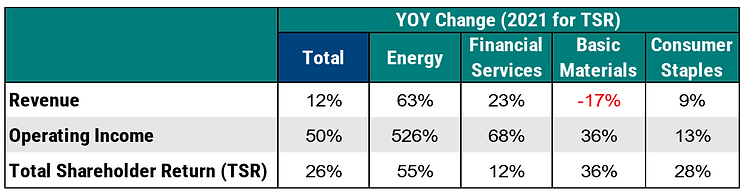
The following memorandum summarizes market trends among a sample of “early filers” including nine S&P/TSX 60 companies (BMO, CIBC, Enbridge, National Bank, RBC, Scotiabank, Suncor, TC Energy, and TD Bank) to highlight expected trends through this proxy season, recognizing that a small sample may not be fully indicative of broader market trends which can vary by industry. As illustrated in Table 1 for the S&P/TSX 60, overall financial and market performance was very strong in 2021 relative to 2020. Total shareholder return was 26% in 2021 v. 3% in 2020, while revenue and operating income significantly grew v. a decrease in 2020.
Table 1: 2021 Performance Summary
MARKET COMPENSATION TRENDS
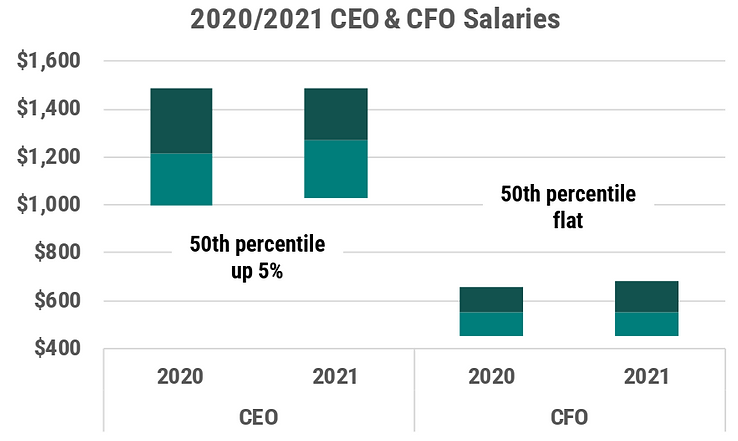
The following compensation trends are based on the same incumbent in both 2020 and 2021 and represent actual compensation disclosed for 2020 and 2021, including salaries, actual bonuses and grant values of long-term incentives (all reported in CAD). As illustrated in Chart 1, salaries were relatively flat between 2020 and 2021 with limited year-over-year changes made (some of the change was the result of pandemic-related reductions rolling off in 2021).
Chart 1: 2020 and 2021 Salaries
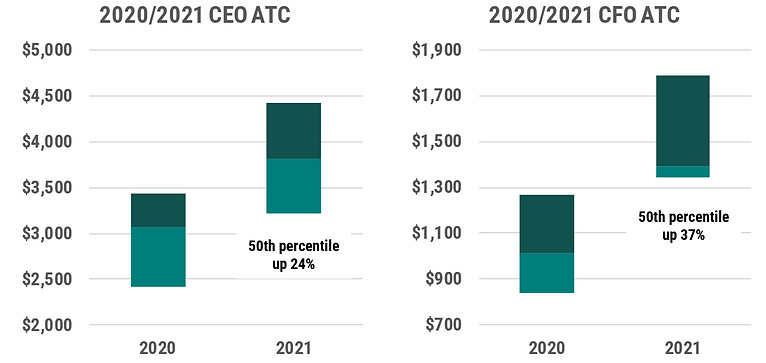
Actual bonuses for 2021 performance were significantly higher than actual bonuses for 2020 performance, with the 50th percentile corporate performance factor increasing 40% for CEOs (from 0.87x target to 1.2x target) and the 50th percentile actual CEO bonus increasing 45% from $1.7M to $2.4M. This results in a year-over-year increase in actual total cash (ATC = salary plus actual bonus) for CEOs of 24% and for CFOs of 37% as illustrated in Chart 2.
Chart 2: 2020 and 2021 Actual Total Cash
Actual total direct compensation (ATDC = ATC + long-term incentives) also increased in 2021 because of higher bonuses (discussed above) and higher grant values of long-term incentives as illustrated in Chart 3.
Chart 3: 2020 and 2021 Actual Total Direct Compensation
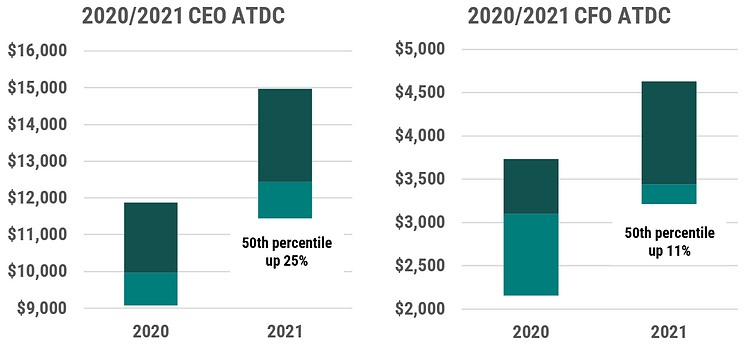
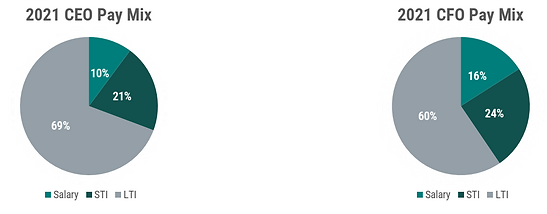
Chart 4 summarizes the overall pay mix for CEOs and CFOs which continue to put a majority weighting on long-term incentives (LTI), with short-term incentives (STI) at approximately 1.5x salary for CEOs and 1.25x for CFOs.
Chart 4: CEO and CFO Pay Mix
The average mix of long-term incentives granted to CEOs and CFOs in 2020 and 2021 did not materially change among the early filers, with no structural adjustments made to the use of performance share units (majority weighted), restricted share units (limited usage) and stock options (minority weighted). We had anticipated that some companies may have reduced the weighting of stock options given the tax changes enacted in 2021; however, it appears that the underlying rationale of stock options (i.e., leverage, absolute share price orientation, long-term nature) outweighed any negative impact on a post-tax basis.
2022 EXPECTATIONS
We believe that these preliminary results will translate across the broader market, resulting in higher pay levels in 2021 relative to a challenging 2020 because of strong financial/market performance. As we look forward, the combination of higher inflation, a tighter labour market (increasingly global) and stronger financial/market performance (despite current challenges) have led to higher-than-normal salary increases for 2022 and higher long-term incentive grant values that are typically made in the first quarter of the year.
In terms of other trends among the early filers, we observe a continued focus on Environmental, Social and Governance (ESG) and its connection to executive compensation (refer to our memo for background). Examples include:
- Suncor adopted climate PSUs that were granted separately from the regular PSUs (which are based on relative TSR and ROCE). These PSUs represent 5% of total LTIs and are aligned with 3-year GHG emission targets that are not yet disclosed
- National Bank added a modifier to the annual incentive plan based on ESG priorities, but the details on how the modifier will be applied were not yet disclosed
- Scotiabank’s ESG-related metrics will become a separate section within the strategic and operational scorecard
There was limited disclosure on other potential changes to executive compensation design, nor did we observe major changes to incentive plan designs for 2021 such that the mix of pay and the mix of LTI vehicles remained constant. Based on our client experience, we anticipate continued discussions on:
- Overall competitiveness of compensation levels and design in an increasingly tight labour market
- Long-term incentive mix including the respective weighting on stock options and whether other longer-vesting LTI vehicles could be included to maintain a long-term orientation beyond three years
- Redefining incentive plans to align with changing strategic priorities, particularly around innovation, digitization, and transformation
Interested in learning more about working with Southlea? Click here
Click to view our Service Offerings