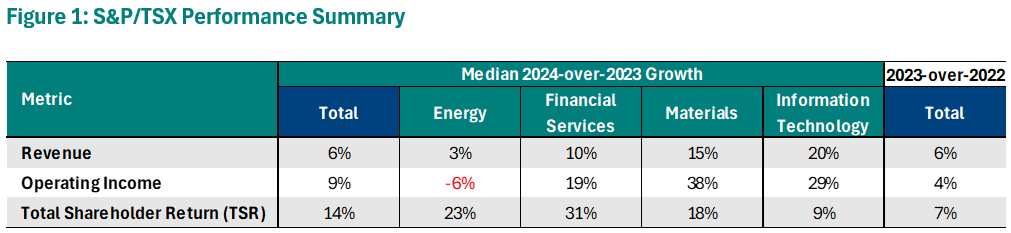
The following summarizes market trends among a sample of “early filers” including eighteen S&P/TSX60 companies to highlight expected trends through this proxy season. As illustrated in Figure 1 for the S&P/TSX Composite, Canadian companies experienced stronger growth on both a market and financial metric basis in 2024 compared to 2023. The financial services sector in particular benefitted from lower interest rates and improving economic sentiment.
Key Takeaways
- Robust performance in 2024 – 2024 performance was stronger relative to 2023 on all metrics measured – in particular, 2024 TSR growth was 14% v. 7% in 2023. Stronger performance appeared to drive increases to incentive payouts on a year-over-year basis
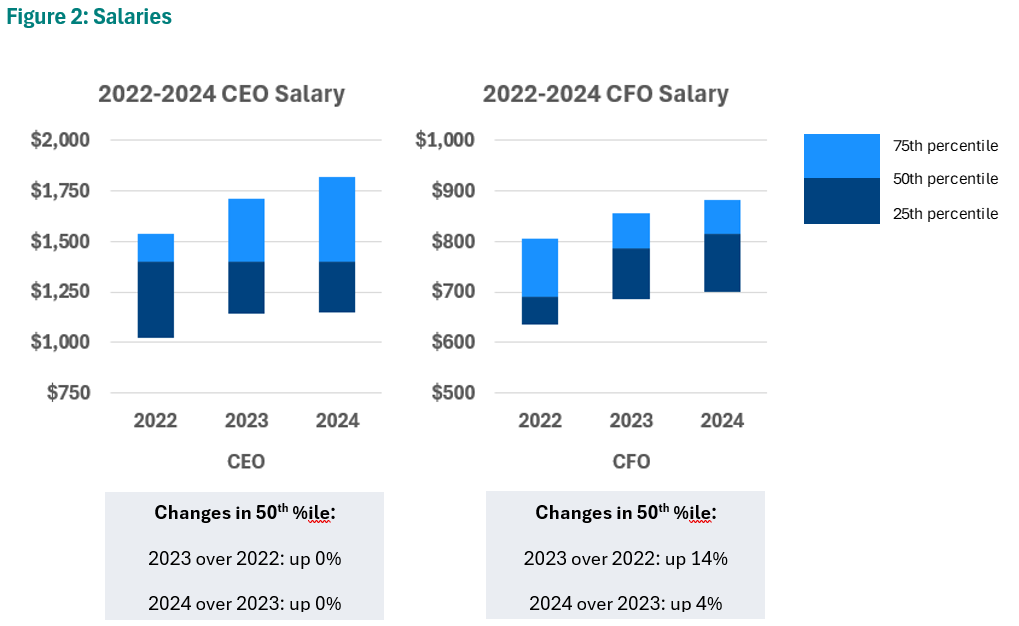
- Modest increases to salary – The median (50th percentile) salary for CEO was flat between 2022 and 2024 at $1.4M, though the 75th percentile increased 11% from 2022 to 2023 and 6% from 2023 to 2024. The median CFO salary increased 4% from 2023 to 2024
- Corporate performance factors trending upwards, PSU payouts relatively flat – The performance factors for annual incentives increased 14 percentage points between 2023 and 2024 to a median of 1.35x target, aligned with strong performance observed across the market. PSU payouts are flat year-over-year, though remain largely above target at around 1.1x target
- Actual total direct compensation continues to increase – Actual total direct compensation (ATDC = salary + actual bonus + long-term incentives) increased 9% between 2023 and 2024 for CEOs and 16% for CFOs. Similar to the trend observed in 2023, the range between median and the 75th percentile for CEOs is widening, with the 75th percentile increasing 27% to $20.9M
- Generally consistent pay mix, minor shift to LTIP – Overall pay mix and LTI vehicle mix remains largely consistent year-over-year, though we observe a slight transition in mix towards LTIP, particularly for CFOs
Market Compensation Trends
The following trends are based on the same incumbent in fiscal years 2022, 2023 and 2024, and represent actual compensation disclosed over the past three years, including salaries, actual bonuses, and grant values of long-term incentives (all dollar values are reported in CAD)[1].
As illustrated in Figure 2, salaries among CEOs have been flat at median over the past three years, though the 75th percentile has increased year-over-year (11% in 2023 and 6% in 2024). While CFO salaries have seen greater increases at median, the increase to 75th percentile is more moderate (6% in 2023 and 3% in 2024).
[1] We note that this is a reversion to the methodology used in 2023 and earlier, possible due to the increase in incumbents in the sample in role for the full in-scope time period (11 CEOs and 7 CFOs).
Corporate performance typically represents a significant portion of the short-term incentives awarded to named executive officers, making the corporate performance factor a large driver of actual bonus paid and resulting total cash.
As illustrated in Figure 3, corporate performance factors have increased over the past 3 years (13 – 14 percentage points per year at median). Broadly, companies often set conservative targets in unpredictable market conditions and the stronger-than-expected post-pandemic economic recovery may have resulted in relative outperformance and higher payout factors. Refer to Southlea’s recently published article on Executive Compensation in Times of Uncertainty for steps to take in response to current geopolitical risks.
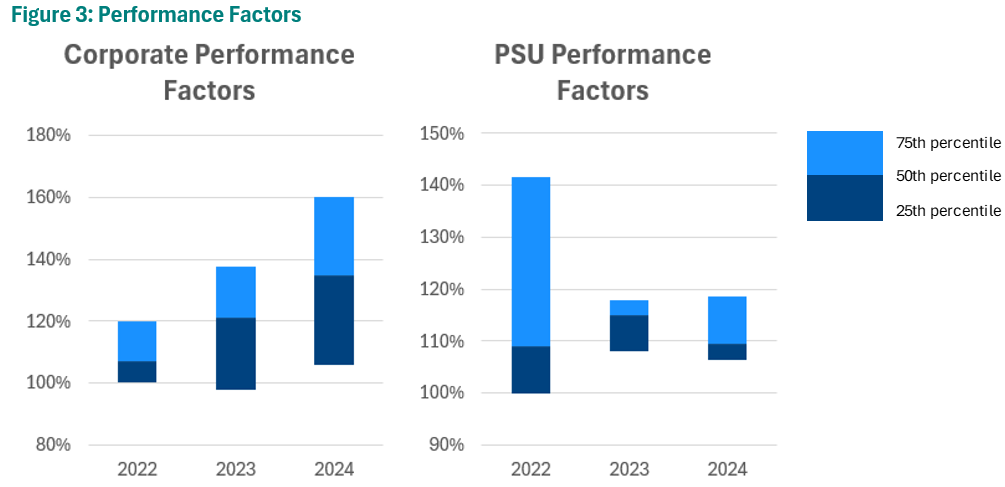
PSU payout factors were relatively stable between 1.09x – 1.15x at median between 2022 and 2024; however, the comparatively wide range of outcomes in 2022 reflects spring 2020 grant dates and associated target setting (amid the height of COVID-related uncertainty) and inclusion of the volatile 2020 performance year.
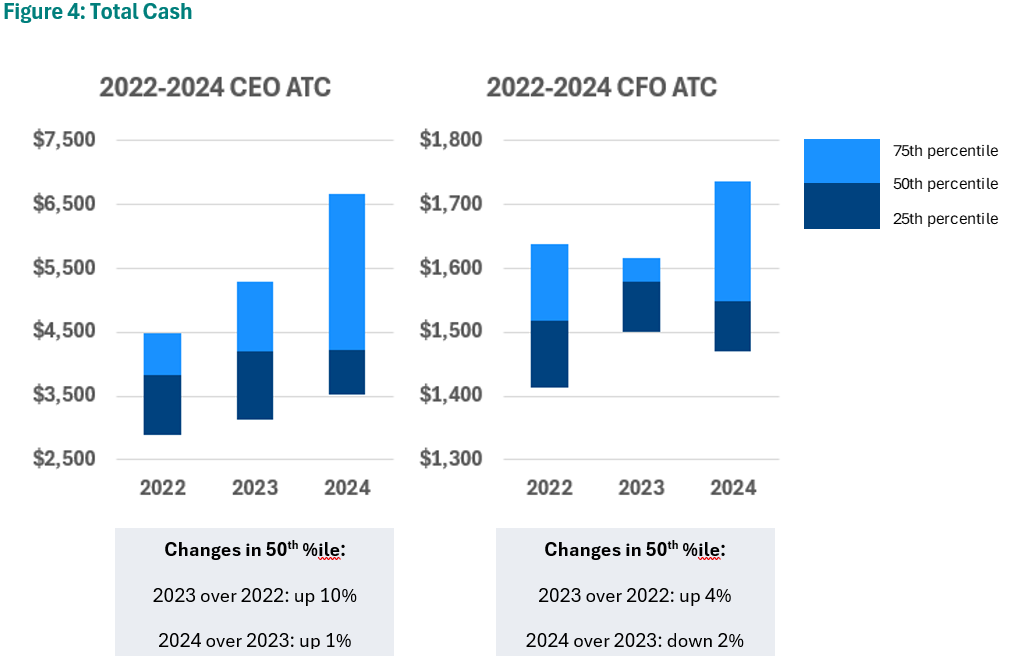
Strong corporate performance resulted in moderate increases to actual total cash year-over-year as the impact of the corporate performance factor is tempered by the other components of the total cash calculation, including fixed salary (ATC = salary + actual bonus). As illustrated in Figure 4, CEO actual total cash increased 10% at median between 2022 and 2023 and 1% at median between 2023 and 2024, though the range of pay increased more meaningfully. CFO actual total cash is more anomalous than CEO due to the smaller sample size.
Actual total direct compensation (ATDC = ATC + long-term incentives) also increased moderately year-over-year between 2022 and 2024, as shown in figure 5. Among CEOs, we observe the increasing range width between the 50th and 75th percentiles, aligned with findings from last year’s analysis in which we hypothesized that the movement was driven by increased competitive pressure for executives outside of Canada, including the impact of the weak CAD:USD exchange rate. These phenomena are discussed further in Southlea’s recently published article: Tackling Currency Challenges in Canadian Executive Compensation. While the ranges are more volatile, the CFO ATDC medians also trend up over the time period.
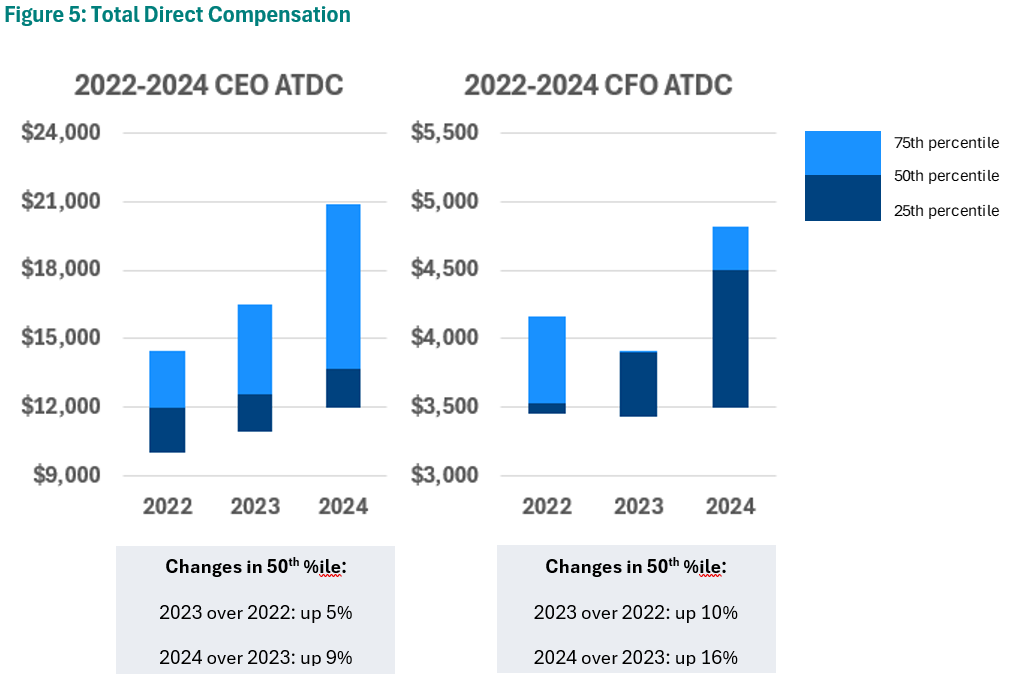
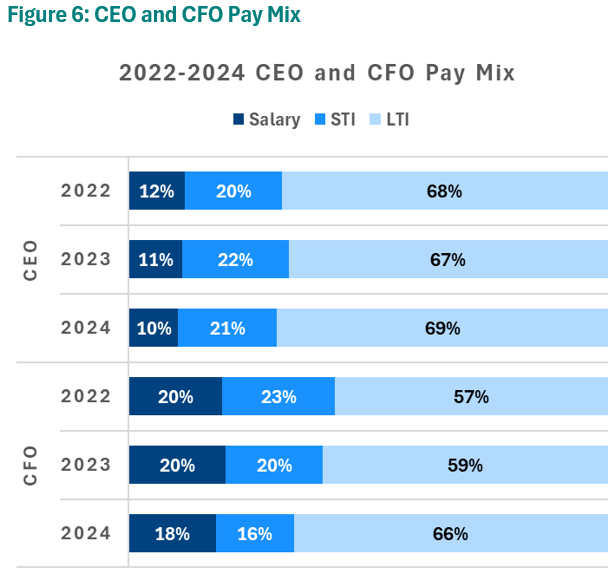
Figure 6 summarizes the overall pay mix for CEOs and CFOs. Long-term incentives (LTI) are most heavily weighted at approximately 70% of pay mix for CEOs and 60% for CFOs, representing grants of ~600% and ~300% of salary, respectively. Short-term incentives (STI) comprise a smaller portion of the pay mix with actual bonuses as a percentage of salary of ~200% for CEOs and ~100% for CFOs. The weights are relatively consistent year-over-year for the CEO role, while the weight for CFOs shifts towards LTI slightly due to increasing LTI grants awarded.
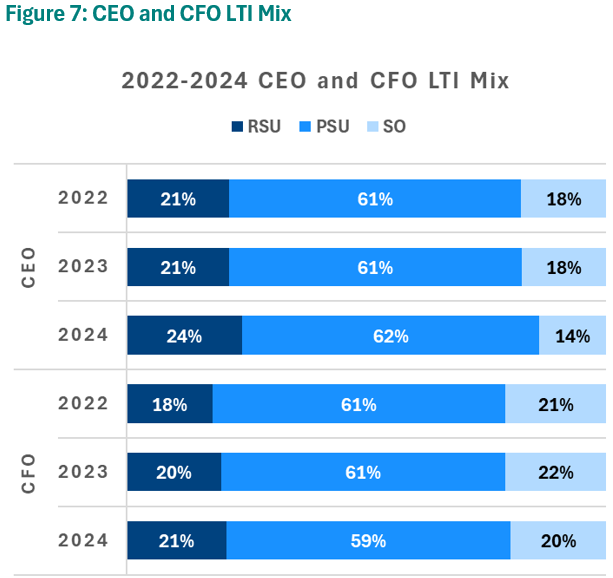
As summarized in figure 7, the average mix of long-term incentives over time is consistent. LTI is mainly delivered in performance share units (PSUs), with more mixed use of restricted share units (RSUs) and stock options (PSUs).
2025 Expectations
In our 2025 Human Resources Committee Outlook, we summarized our top five predictions for 2025 including greater risks and uncertainties affecting incentive designs, integrating talent management with compensation, pressures on executive pay levels, maturing ESG incentive measures, and going outside of established compensation norms.
Aligned with our 2025 predictions, we expect these preliminary results to apply across the broader market, resulting in greater increases to pay levels in 2024 than observed in recent years. The increases may be delivered in LTIP – as we see the market for executive talent among large Canadian companies become increasingly North American-oriented, Canadian organizations may adopt the U.S. practice of awarding higher LTIP grants (largely responsible for the U.S. pay premium). Higher weight on LTIP also creates pay-for-performance alignment and adheres to shareholder preferences and proxy advisor guidance.
In reviewing the disclosure for these early filers, we observe the following examples of changes to executive compensation for 2025:
- CIBC will continue to streamline measures in its ESG Index, used in its Business Performance Factor
- Rogers is adding relative Total Shareholder Return when compared to Bell, Telus, and Quebecor as a PRSU metric in addition to adjusted EBITDA. 2025 grants will also use a payout curve with a maximum of 200% (historically 100%)
- Canadian National Railway is changing its assessment of customer centricity in its annual incentive plan, replacing Net Promoter Score with a customer sentiment index
About The Authors
Caroline Marshall, Consultant & Will MacInnis, Intern
Prior to joining Southlea Group, she worked as an Associate at a large, global multi-service consulting firm, providing analytical support on executive and broad-based compensation projects.
She has experience supporting companies with a variety of compensation-related initiatives, including total rewards philosophy and peer group development, competitive benchmarking of board, executive, and broad-based pay, short- and long-term incentive plan design, and governance of compensation programs.
Caroline has experience working across many sectors, including financial services and Canadian pension plans.
Caroline has an Honours Business Administration degree from Wilfrid Laurier University and an Honours Mathematics degree from the University of Waterloo.