In 2021, we saw a significant recovery from 2020 in terms of stronger revenue and operating income growth and total shareholder return. We continue to see significant differences by industry, with energy and financials outpacing materials and consumer staples (refer to Table 1). As we look forward to 2022, we anticipate more challenging performance conditions (e.g., weaker total shareholder returns [down 7% YTD]) given higher inflation and interest rates, lower growth expectations and overall geopolitical uncertainty. Continued volatility in financial and market performance will raise questions on the calibration and resilience of incentive targets and the level of discretion required to evaluate performance.
Table 1: 2020/2021 Performance Summary

MARKET COMPENSATION TRENDS
The following compensation trends are based on the same incumbent through 2020 and 2021, and reflect actual compensation disclosed in 2021 and 2022 proxy circulars, including actual salaries, actual/target bonuses and long-term incentive grants (all reported on a nominal currency basis, as disclosed).
Chart 1: 2020 and 2021 Salaries
The median CEO salary in 2021 increased by 16% to $1.223M (from $1.05M in 2020), primarily reflecting the reversal of pandemic-related salary reductions. The median increase was only 3%. The median CFO salary increased by 2% to $598,000.
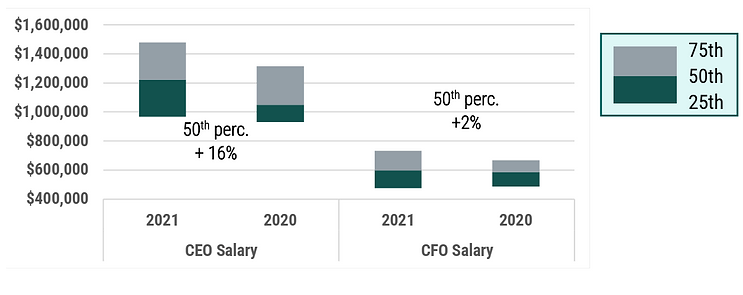
Chart 2: 2020 and 2021 Actual Total Cash
Median actual total cash (ATC) increased by 36% for CEOs and 30% for CFOs, driven by significantly higher bonuses in 2021. The median actual bonus as a percentage of target bonus for CEOs increased to 1.41x target in 2021 from 1.04x target in 2020.
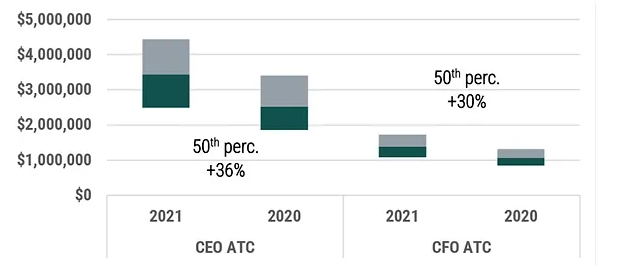
Chart 3: 2020 and 2021 Actual Total Direct Compensation
Median actual total direct compensation (ATDC) increased by 20% for CEOs and 18% for CFOs in 2021, primarily driven by higher actual bonuses. The median grant value of long-term incentives remained flat at ~500% of salary for CEOs and ~285% of salary for CFOs.
We observe a relationship between company size – in terms of market capitalization – and CEO actual total direct compensation (i.e., larger companies pay more in absolute terms than smaller companies); an important consideration when interpreting these findings.
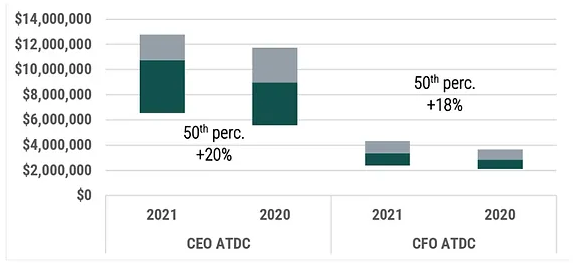
Table 2: Year-Over-Year Changes in 50th Percentile Pay
As illustrated in Table 2, year-over-year changes in target compensation, where disclosed, were relatively flat with an approximate 3% increase in 50th percentile target total direct compensation for both CEOs and CFOs.

Table 3: Significant Year-Over-Year Changes in CEO ATDC
There were several large year-over-year compensation changes among CEOs, primarily due to changes in LTI grants and, in many cases, one-time or situational LTI awards (refer to Table 3 for details).

Gender Distribution
We also reviewed the gender distribution of the CEOs and CFOs within the S&P TSX 60 and found no female CEOs and only seven female CFOs. Given the limited number of female CEOs and CFOs, we were unable to review the data by gender. Amongst all named executive officers (NEOs), we saw a slight increase in the number of female NEOs from 15 to 21 (6% to 7%) of all NEOs.
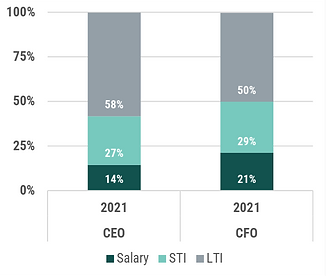
Chart 4: CEO and CFO Pay Mix
In terms of overall CEO and CFO pay mix, Chart 4 shows that salary (or fixed pay) represented less than 20% of actual total direct compensation.
Actual short-term incentives (STI) represented approximately 2.0x salary for CEOs and 1.4x for CFOs and comprised a higher proportion of pay relative to 2020 due to the higher bonuses paid in 2021.
Companies continued to put a majority weighting on long term incentives (LTI). This captures the value of the LTI at grant, but the actual value realized can vary quite significantly, reinforcing the importance of ensuring this portion of compensation is designed appropriately and aligned with strategy / shareholder interests.
SHORT-TERM INCENTIVES (STI)
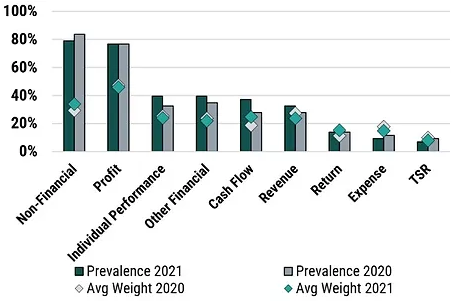
Chart 5 summarizes the prevalence and mix of performance measures within the STI plan. Non-financial and profit based measures were the most common, with non-financial measures weighted at about 30% and profit measures at about 50% of the overall STI score. The use of ESG-related measures continued to evolve and we will be conducting further research on market trends through 2022.
Chart 5: Prevalence and Mix of STI Performance Measures
LONG-TERM INCENTIVES (LTI)
Chart 6 (on the left) summarizes the prevalence of the long-term incentive vehicles granted to the CEO in 2021 and 2020 and Chart 7 (on the right) summarizes the average mix of long-term incentives granted to CEOs over the same period. There was a slight increase in the prevalence and weighting on performance-based stock (i.e., performance share units or PSUs) in 2021, while the prevalence of stock options (about 65%) and their weighting in the overall LTI portfolio (about 25%) remained fairly consistent.
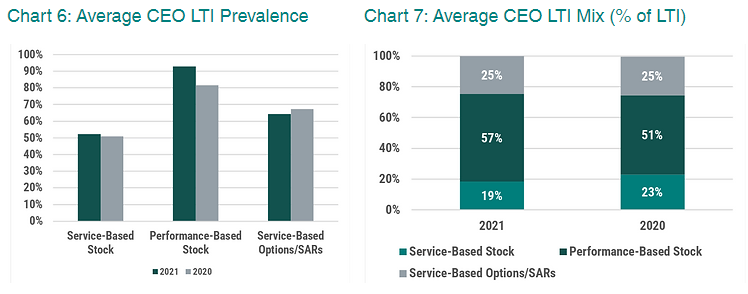
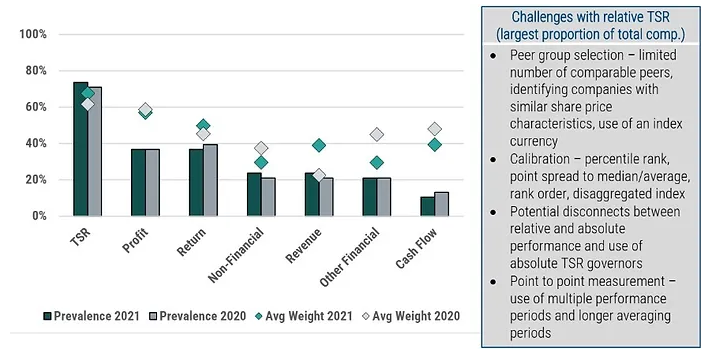
Chart 8 summarizes the prevalence and mix of performance measures in PSU plans. We saw some shifts in the types of measures, but average weightings remained generally consistent. Total shareholder return (TSR) remained the most common metric with an average weighting of approximately 60%. Given the increasing use of PSUs and relative TSR, there is more pressure on companies to get this component right in terms of participant and shareholder alignment.
Chart 8: Prevalence and Mix of PSU Performance Measures
PAY-FOR-PERFORMANCE
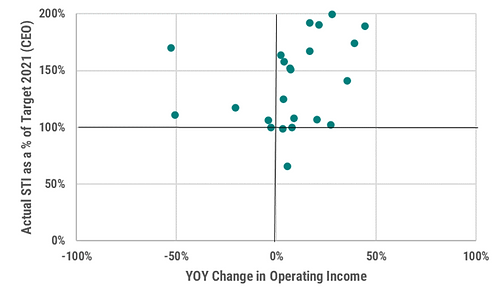
Chart 9 compares the year-over-year change in operating income with CEO actual bonus as a percent of target bonus (outliers were excluded). There tends to be a correlation between operating income growth and an above-target actual bonus, as shown in the top right quadrant. A few companies had negative operating income growth but provided a bonus that was above target, which can occur if financial performance is not a core driver of the bonus and/or in other extenuating circumstances. There are also some questions on the rigour of the underlying incentive target-setting process among this group of companies, given the relationship between operating income growth and actual STI awards (as a % of target).
Chart 9: CEO Bonus relative to change in Operating Income
SAY-ON-PAY
Charts 10 & 11 summarizes the say-on-pay results (as of June 30, 2022) for Canada (left) and the U.S. (right). In Canada, the average say-on-pay vote remained strong at 92% in both 2022 and 2021. In the U.S., the average score decreased slightly to 87% from 88% and 89% in 2021 and 2020, respectively. Refer to our earlier memo for further details.
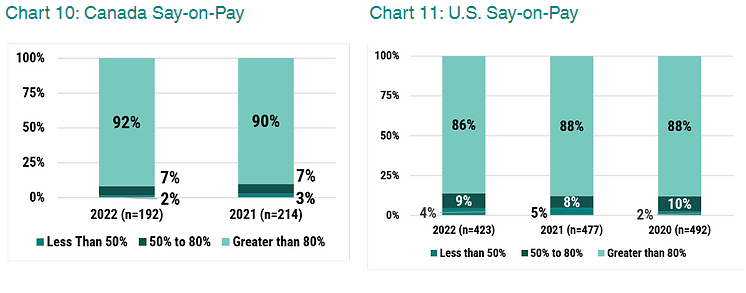
For most companies, there is little year-over-year change in the reported say-on-pay results and Table 4 highlights the most significant year-over-year increases and decreases. There were six failures in 2021 and only three failures (as of June 30) in 2022 with CI Financial failing in both years.
Table 4: Significant Year-Over-Year Changes in Say-on-Pay Support

OUR PREDICTIONS

We will be publishing additional updates for the entire TSX Composite Index and by major sector throughout 2022.
Interested in learning more about working with Southlea? Click here
Click to view our Service Offerings